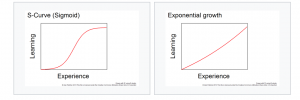
It is common sense that everyone learns differently, and that teachers should do their best to use a variety of methods to transfer knowledge from themselves to their students. Of course, we also want learners to do more than solve problems they have seen before. This means that we want them to be able to apply whatever they have learned to solving new problems in novel settings. This also means we want them to acquire what psychologist William James referred to as “an inventive mind.”
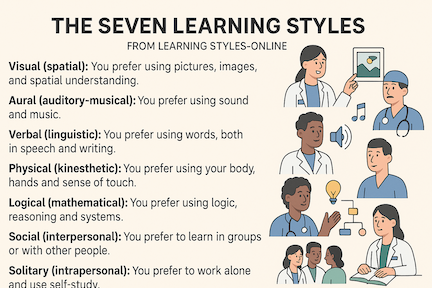
Artificial Intelligence (AI) is favorably impacting this environment because it empowers learners. It offers them a variety of tools so they may embark on “learning paths” that best suit their individual natural preferences and particular customizable circumstances. Whether it be from the elaboration of interactive diagrams, engaging with chatbots, receiving instant feedback, or listening to individually-tailored audio lessons, for example, AI promotes learning according to Visual, Auditory, and Verbal styles. By interacting in a digital space or AI-driven simulation, using algorithm-based tutors that evolve as individuals progress, and collaborating with others through smart platforms, people who benefit most from physical, logical, and social styles can also expand their means for learning. And let’s not forget that AI promotes independent study by offering learners an opportunity to formulate a series of increasingly complex or deep-rooted queries simply by repeated interactions with programs such as ChatGPT, Claude, or Gemini (and others).
So, what does this mean for bronchoscopists and interventional pulmonologists? It means we must rethink the way we organize educational programs, on-site or remotely-delivered lectures, conferences, and even hands-on workshops. It probably means increased emphasis on a learning by doing methodology, or what the philosopher John Dewey referred to as “activity methods,” at the bedside, in the classroom and procedure suite, as well as in the conference hall. The transition will come naturally for a new generation of learners and teachers but may pose a significant challenge for old-schoolers and those inclined to be resistant to change.